How the live mock cohort scored
Thank you to everyone who took part in the JZ Exam Set B live mock on 20 September. I’m sharing the score distribution here for anyone working through Set B, or considering trying it.
The chart below shows the estimated TMUA scores of 123 students, with incomplete attempts excluded.
How to read the chart
Each bar shows the percentage of students within a half-point score band, labelled by its upper limit. For example, 5.5 represents scores above 5.0 and up to 5.5. The 9.0 bar includes everyone above 8.5, rather than only students who scored exactly 9.0. For anyone wondering, five students received an estimated score of 9.0.
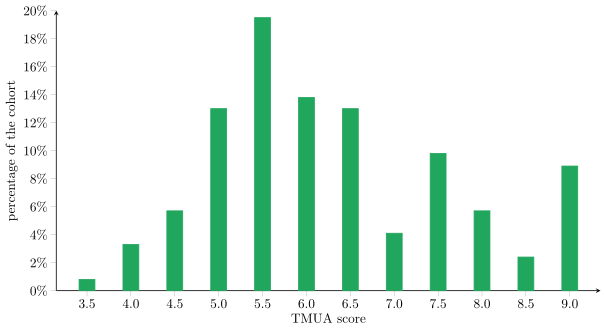
The median estimated score was 5.6, with the middle half of students scoring between 5.2 and 7.1.
Putting the results in context
In my judgement as the author, Set B was slightly harder than the current TMUA—sorry! 😂 I’ll aim a little closer next time. The score conversion aims to account for the difficulty, although these remain estimates rather than official TMUA results.
This cohort also included many strong candidates, so your position within this group should not be read as your position among all TMUA candidates.
If your result was below what you hoped for, I would encourage you to look beyond the headline score and work through the questions with the solutions. I spent a lot of time writing those explanations, and I hope they help—please do let me know if anything is unclear.
The challenge in these questions generally lies in finding an approach, rather than lengthy calculations. With the key insight, most can be completed within three minutes—although finding that insight under exam pressure is, of course, part of the challenge.
Above all, I hope you take this mock as an opportunity to learn and improve. Give yourself credit for what went well, then choose a few questions where understanding the underlying idea would help you next time. Whatever your score, that is useful progress to take from this sitting.